Figure 4.
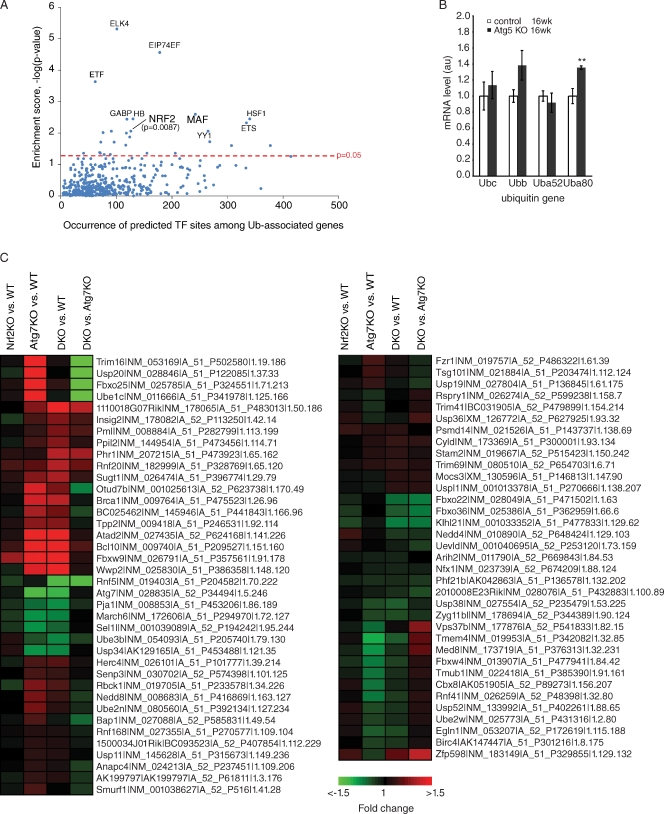
Nrf2 transcription factor–binding sites are enriched among Ub-associated genes. (A) Enrichment of predicted transcription factor (TF)–binding sites in the promoter region (−5,000 to 300) of Ub-associated genes versus its representation genome wide. The top 10 most enriched transcription factor–binding sites predicted among Ub-associated genes are labeled, with their enrichment scores (or −Log10–transformed Benjamini–Hochberg-adjusted p-values) plotted against its occurrence. (B) Elevated Ub mRNA levels from Atg5-deficient brains. Total RNA was extracted from control Atg5 littermates (Atg5flox/+;nestin-Cre) at 16 wk or Atg5 KO (Atg5flox/flox;nestin-Cre) at 16 wk (n = 4 for each genotype; **, P ≤ 0.01) and the amount of transcript from Ubc, Ubb, Uba52, and Uba80 genes was quantified using real-time RT-PCR and normalized to actin. Error bars indicate SEM. au, arbitrary unit. (C) Gene expression analysis of Ub-associated Nrf2 targets mapped to mouse orthologues. Probes detecting transcripts exhibiting differential expression (Benjamini–Hochberg-adjusted P < 0.05) in at least one of the four comparisons are shown. Heat map represents Log2 (fold changes) with respect to either wild type (WT) or Atg7 KO (as indicated). Labels show the symbol, RefSeq (accession numbers from the NCBI Nucleotide database), gene probe name, and the gene row and gene column (i.e., array coordinates).

