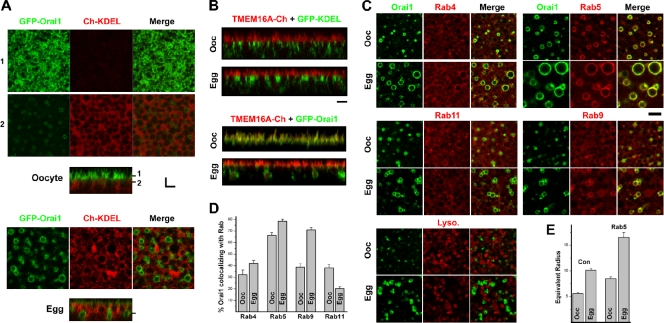
Figure 1.
Orai1 subcellular distribution at rest and during meiosis. (A) Oocytes and eggs expressing GFP-Orai1 (2 ng RNA/cell) and the ER marker mCherry-KDEL (10 ng RNA/cell). Confocal images show two focal planes as indicated by the matching numbers (1 and 2) in the orthogonal section across the z-image stack. Bar, 3 µm. (B) Orthogonal sections from cells expressing 8 ng xTMEM16a-mCherry with either 5 ng GFP-KDEL or 2 ng GFP-Orai1. Bar, 3 µm. (C) Oocytes and eggs expressing GFP-Orai1 with endosome markers including RFP-Rab5, mCherry-tagged Rab4, Rab9, and Rab11 or stained with the lysosome marker LysoTracker. Bar, 5 µm. (D) Percentage of Orai1-positive pixels colocalizing with the Rabs (n = 10–15). (E) Equivalent endosome radius measured using MetaMorph (n = 9–13). Error bars indicate mean ± SEM.

