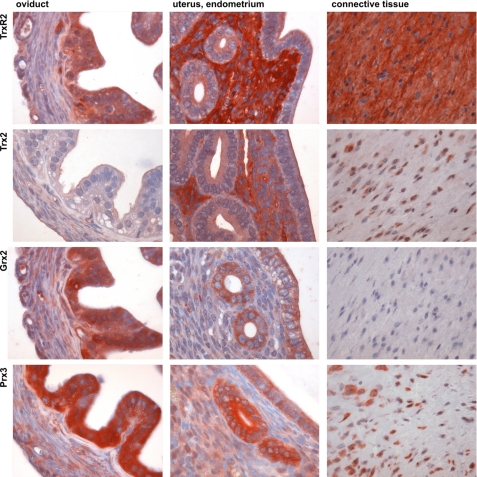
FIGURE 4.
Distribution of Prx3, Trx2, TrxR2, and Grx2 immunoreactivity in mouse tissues, oviduct, uterus, and connective tissue. The oviduct (magnification, ×500) showed strong staining for TrxR2, Grx2, and Prx3, whereas Trx2 was basically absent. The endometrium of the uterus (×500) displayed a correlative staining for TrxR2 and Trx2 as well as for Grx2 and Prx3, with an apparent inverse staining pattern. Cells of the connective tissue (×250) were strongly stained for Prx3 and Trx2, whereas no staining could be detected for Grx2.

