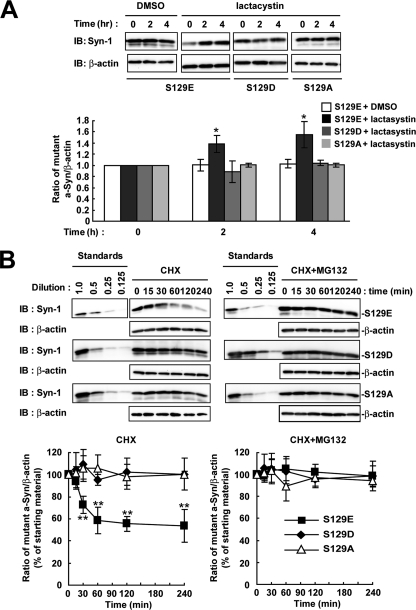
FIGURE 5.
The metabolism of phosphorylation-mimic and phosphorylation-abolished mutant a-Syn in SH-SY5Y cells. We used S129E and S129D as phosphorylation-mimic mutants, and S129A as phosphorylation-abolished mutant of a-Syn. A, cells were transiently transfected with one of the a-Syn mutant cDNAs, and treated with or without 10 μm lactacystin for 4 h. The cell lysates (10 μg/lane) were analyzed by immunoblotting (IB) with Syn-1 antibodies or anti-β-actin antibody. The graph shows relative ratios of the band intensity of mutant a-Syn to β-actin by normalizing to the starting materials. B, at 42 h after transfection, the cells were pre-incubated in medium containing either 0.1% DMSO or 10 μm MG132 for 6 h. Then, 100 μm CHX was added into medium. The cells were collected at the indicated times. The cell lysates (10 μg/lane) were analyzed by immunoblotting (IB) with Syn-1 antibody or anti-β-actin antibody. Experiments were performed three times. Graphs show quantitative analysis of the alteration in the expression levels of mutant a-Syn. Relative ratios of the band intensity of mutant a-Syn to β-actin are shown by normalizing to the starting materials. Data represent means ± S.D. and the p values (*, p < 0.05; **, p < 0.01) are shown.

