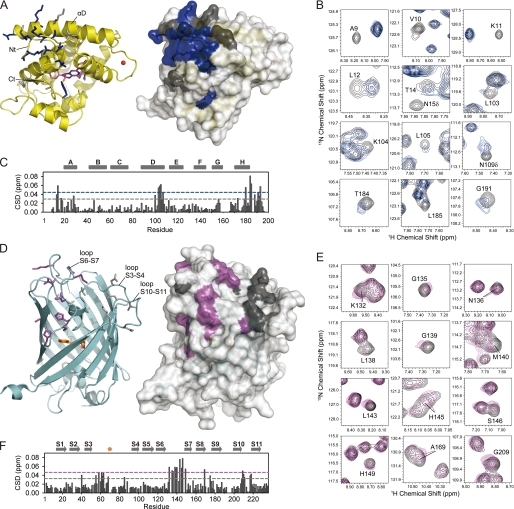
FIGURE 2.
Chemical shift mapping identifies the interaction surfaces of clytin and cgGFP. On crystal structures of clytin (A) and cgGFP (D) the interfacial residues mapped according to cross-peak/intensity shift are shown as sticks and highlighted in color on the surface. B & E, 1H-15N HSQC spectra areas derived from superposition of 15N-labeled clytin (B, black) and 15N, 2H-labeled cgGFP (E, black) with unlabeled cgGFP (blue) and clytin (magenta), respectively. C & F, weighted-average chemical shift differences (CSD) between 15N-clytin (C) or 15N,2H-cgGFP (F) and 1:3 15N-clytin/cgGFP and 1:2 15N,2H-cgGFP/clytin mixtures. The dashed lines represent the one standard deviation (gray) and two standard deviations (blue, magenta) cut-offs. Residues, whose cross-peak shifted more than one or two standard deviations above the average, are mapped on the spatial structures in gray and blue for clytin, and in gray and magenta for cgGFP, respectively. Residues of clytin (mostly N-terminal) with significant peak intensity perturbations, are also mapped in blue.

