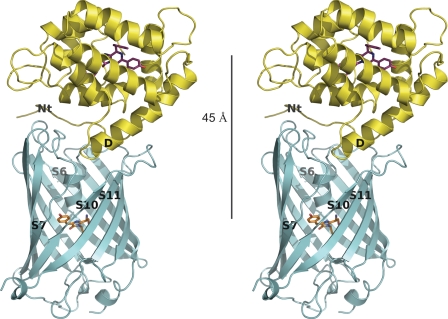
FIGURE 3.
Stereoview representation of the spatial structure of the clytin-cgGFP complex derived from x-ray structures of clytin and cgGFP, NMR-mapping of the interaction surfaces and computational docking in HADDOCK. 45 Å is the distance between the two chromophores. Structural elements of clytin and cgGFP comprising the interaction surface are labeled.

