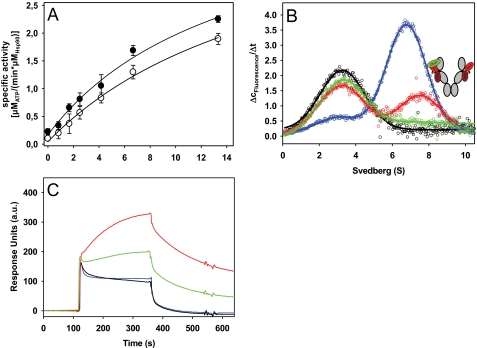
FIGURE 4.
Interaction of Aha1 with Cdc37-Hsp90 complexes. A, stimulation of the ATPase activity of Hsp90 was determined in low salt buffer (20 mm KCl) with increasing amounts of Aha1 either in the absence of Cdc37 (●) or in the presence of 10 μm Cdc37 (○). Data were analyzed as described under “Experimental Procedures.” B, Δc/Δt plots were generated from sedimentation velocity experiments of 150 nm *Cdc37, either in the absence (black) or in the presence of 3 μm Hsp90 (blue). 5 μm Aha1 was added to 150 nm *Cdc37 and 3 μm Hsp90, either without the addition of nucleotide (red) or with the addition of 4 mm AMP-PNP (green). Experiments were performed in standard buffer containing low salt (20 mm KCl). The schemes represent the proposed conformations of Hsp90, with *Cdc37 depicted in green and Aha1 in red. C, surface plasmon resonance analysis of the interaction of chip-bound Aha1 with Hsp90. Experiments were performed in standard buffer containing 80 mm KCl. The interaction of Hsp90 with immobilized Aha1 was studied either in the absence of nucleotides (black) or in the presence of 2 mm AMP-PNP (red), 2 mm ATPγS (green), or 2 mm ADP (blue). a.u., arbitrary units. Error bars, S.D.

