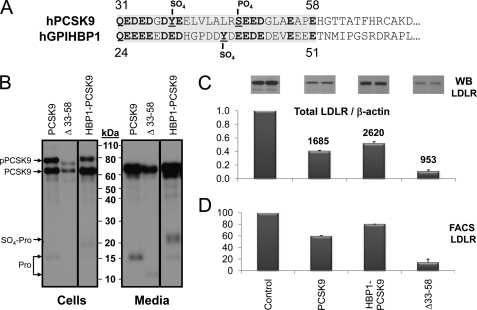
FIGURE 6.
Biosynthetic analysis and comparative activity of PCSK9 and its HBP1 chimera. A, alignment of the acidic N-terminal domains of human PCSK9 and GPIHBP1. The shaded regions were swapped in the HBP1-PCSK9 chimera. Boldface residues emphasize the homology of acidic residues, including the Tyr sulfation and Ser phosphorylation. B, SDS-PAGE analysis of mAb-V5 immunoprecipitated materials obtained following a 3-h pulse labeling with [35S]Met + -Cys of HEK293 cells transiently overexpressing each construct, including wild type PCSK9, its Δ33–58 construct, and HBP1-PCSK9 chimera. The slower migrating prosegment associated with the HBP1-PCSK9 chimera is likely to be the Tyr-sulfated form, as predicted (31). C, Western blot analysis of total LDLR levels of HuH7 cells exposed to various constructs for 4 h. The bar graph represents the average values of two independent experiments shown above each bar. The numbers above each bar represent the levels of PCSK9 in ng/ml measured by ELISA. D, FACS analysis for LDLR expression following a 4-h incubation of HuH7 cells with 0.7 μg/ml of the represented constructs, estimated by ELISA.

