FIGURE 2.
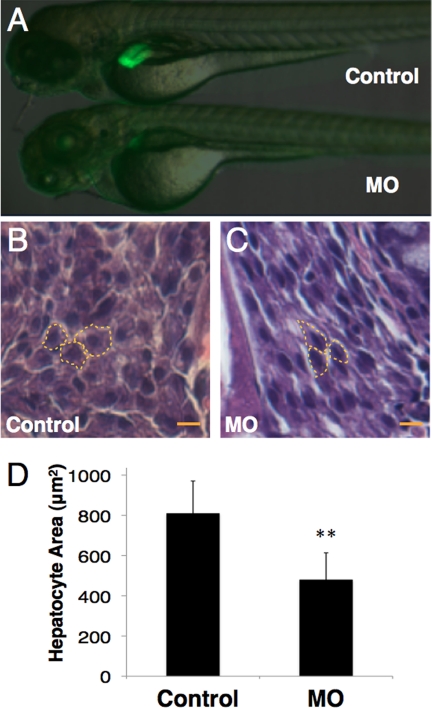
Liver morphology of 4-dpf grnA morphants. A, liver morphology at 4 dpf. Compared with fish that were injected with a MO containing mutations in five base pairs, the EGFP expression of Tg(fabp10:EGFP) zebrafish faded after MO (0.25 ng/embryo) administration. B and C, hematoxylin and eosin stained hepatocyte sections from grnA morphants. The cell size was determined by measuring the area of a single hepatocyte (dotted line). MO administration decreased the mean hepatocyte area as compared with the controls (n = 3). Scale bars, 25 μm. **, p < 0.01, t test. Error bars indicate S.D.

