FIGURE 4.
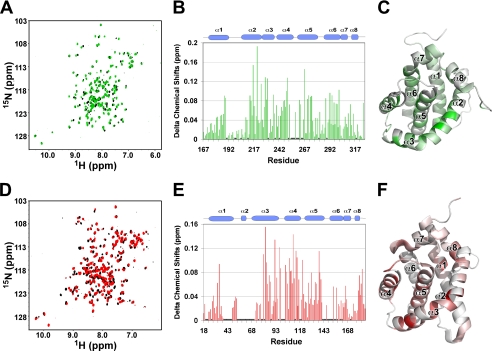
Behavior of cBAK and cMCL-1 in CHAPS. A, HSQC overlay of 15N-labeled cMCL-1 without (black) and with 2% CHAPS (red). B and E, plots of CHAPS-induced chemical shift changes by residue for cMCL-1 (B) and cBAK (E). Prolines and residues that were unassigned in either the free or bound form are labeled with asterisks. C and F, three-dimensional models of cMCL-1 (C) and cBAK (F) (6) colored according to the size of the chemical shift changes upon the addition of CHAPS. The colors range from gray for no change to green (0.19 ppm) or red (0.155 ppm). D, HSQC overlay of 15N-labeled cBAK without (black) and with 2% CHAPS for 20 min (red).

