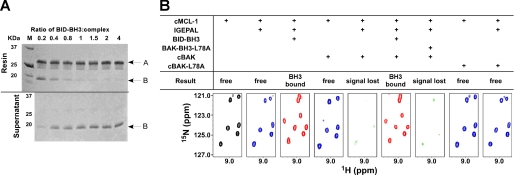
FIGURE 8.
BID-BH3 peptides disrupts the complex of MCL-1·BAK. A, Coomassie-stained SDS-PAGE gels showing the results of the competition assay in 0. 1% IGEPAL. The upper panel gel shows proteins that were pulled down by the Ni2+-NTA resin, and the lower panel gel shows proteins that remained in the supernatant. The numbers above the gel show the ratio of BID-BH3 peptide to FLAG-BAK-HMK-ΔTM-His6·cMCL-1 complex when added for competition. The arrow labeled A shows the position of FLAG-BAK-HMK-ΔTM-His6, and arrows labeled B show the position of cMCL-1. B, slices of 1H-15N HSQC spectra (bottom) of 15N-labeled cMCL-1 in different conditions as shown. The spectra are color-coded according to the size of the spectral changes: black, free (control) cMCL-1 spectrum; blue, spectra with small chemical shift changes; pink, spectra with significant changes; green, spectra with absent signals).

