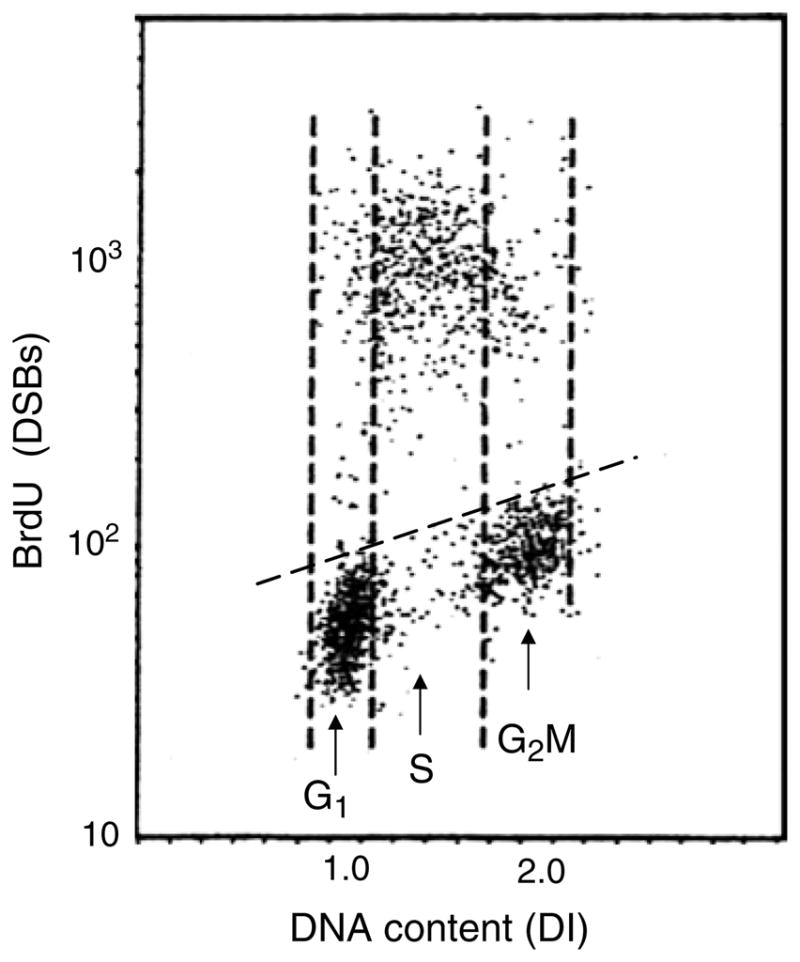
Fig. 1.

Detection of apoptotic cells after DSBs labeling with BrdUTP and fluorescence analysis by flow cytometry. To induce apoptosis leukemic HL-60 cells were treated in culture with DNA topoisomerase I inhibitor topotecan (0.15 μM) for 4 h. The cells were then subjected to DSBs labeling with BrdUTP as described in the protocol using fluorescein-tagged BrdU Ab and staining DNA with PI. Cellular fluorescence was measured by flow cytometry. The data are presented as the bivariate distributions (scatterplots) illustrating cellular DNA content (DNA index, DI) versus DSBs labeled with BrdU Ab. Note that essentially only S-phase cells underwent apoptosis as shown by high intensity of their BrdU-associated fluorescence, above the control level marked by the skewed dashed line. The leukemic cells treated with topoisomerase I inhibitors topotecan or camptothecin for 3–5 h present a convenient experimental model to assess whether the protocol of DSBs labeling is effective because in the same cell population there are DSBs positive (S-phase) and negative (G1 and G2M) cells.
