Fig. 2.
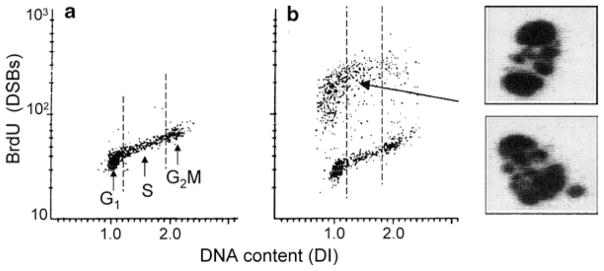
Detection of apoptotic cells after DSBs labeling with BrdUTP and analysis by LSC. U-937 cells were untreated (a) or treated with tumor necrosis factor-α (TNF-α) in the presence of cycloheximide (b, (22, 23)). The cells were then subjected to DNA strand break labeling and DNA staining as described in the protocol using fluorescein-tagged BrdU Ab and staining DNA with PI. Cell fluorescence was measured by iCys® Research Imaging Cytometer. The bivariate distributions (scatterplots) allow one to identify apoptotic cells as the cells with labeled DSBs (strong green fluorescence intensity), and also reveal the cell cycle position of cells in either apoptotic or nonapoptotic population. Note pre-dominance of G1 cells among apoptotic cells. The cells with strong DSBs labeling were relocated, imaged, and their representative images are presented as shown. These cells show nuclear fragmentation and chromatin condensation, the typical features of apoptosis (3, 4).

