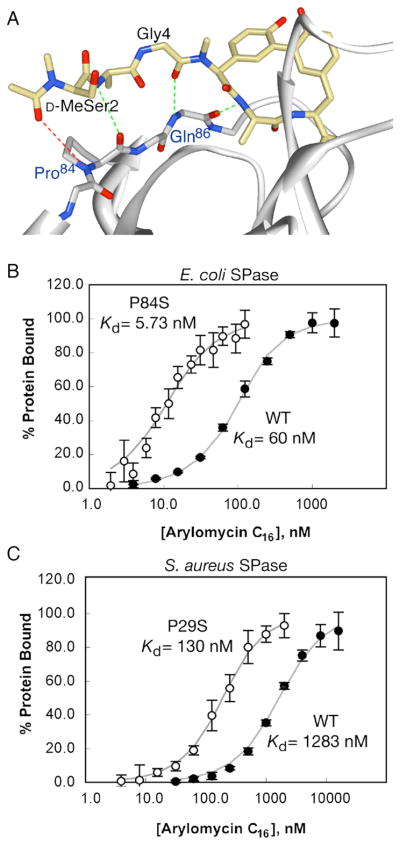
Figure 3. Physical and biochemical evidence for the proposed mechanism of arylomycin resistance.
(A) Crystal structure of E. coli SPase in complex with arylomycin A2 (PDB ID 1T7D) (Paetzel et al., 2004). Hydrogen-bonds observed in the crystal structure are shown in green, while the potential hydrogen bond prevented by Pro84 is shown in red. Equilibrium binding affinities of arylomycin for Pro- and Ser- variants of E. coli (B) and S. aureus (C) SPases. Data points and bars represent average values and standard deviations within a single experiment. KD values shown are the average of three independent experiments. See also Figure S2.

