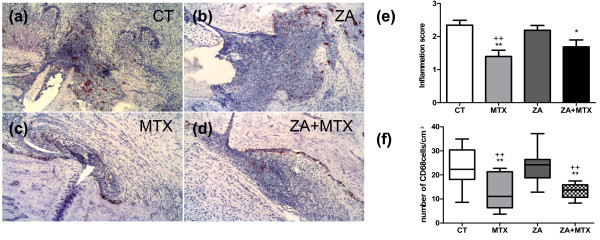
Figure 3.
Representative histological profiles of rat ankle joints at the end of the experiment. The (a) control, (b) methotrexate (MTX), (c) zoledronic acid (ZA), and (d) ZA + MTX groups are shown (×10). Immunohistochemical staining, with CD68+ cells stained brown. (e) Histological inflammation score. MTX, whether used alone or in combination with ZA, significantly decreased the inflammation score, as shown by comparisons with the control group. (f) Number of CD68+ cells per unit area of inflammation. MTX, whether used alone or in combination with ZA, resulted in the presence of significantly fewer CD68+ cells than observed in the control and ZA groups. *P < 0.05 versus computed tomography (CT) group; **P < 0.005 versus CT group; ++P < 0.005 versus ZA group.

