Figure 4.
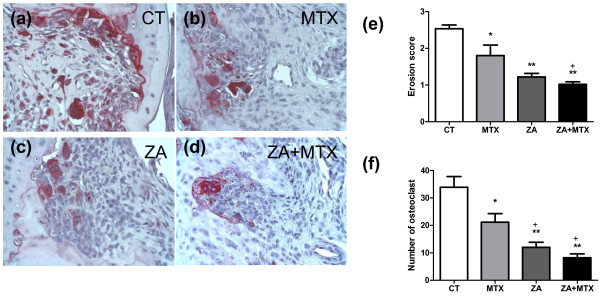
Representative TRAP staining profiles. The (a) control, (b) zoledronic acid (ZA), (c) methotrexate (MTX), and (d) ZA + MTX groups are shown (×40). (e) Erosion score. Bone erosion was strongly inhibited in the ZA group. MTX also significantly reduced bone erosion, although to a lesser extent than ZA. (f) Number of osteoclasts (multinucleated tartrate resistant acid phosphatase (TRAP) positive cells) at the bone/synovium interface in the eroded joint of the tibiotarsal and intertarsal joints. ZA, used alone or in combination with MTX, strongly decreased the number of TRAP-positive cells. MTX also decreased the number of TRAP+ cells in the eroded joint. *P < 0.05 versus computed tomography (CT) group; **P < 0.005 versus CT group; +P < 0.05 versus MTX group.

