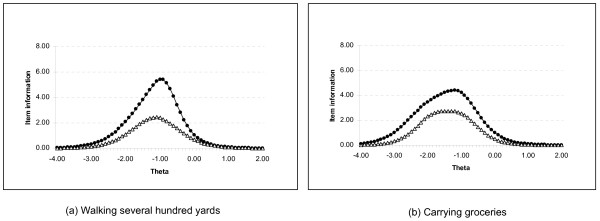
Figure 2.
Information content for two typical physical-function items. The figures indicate that rewritten items (dashed lines) have improved information content compared with their Legacy counterparts (solid lines). Item information is a function of the area under the curve. A theta of zero represents the population mean (x-axis). Each integer is one standard deviation above or below the mean. More-severe illness is represented by points to the left of zero.

