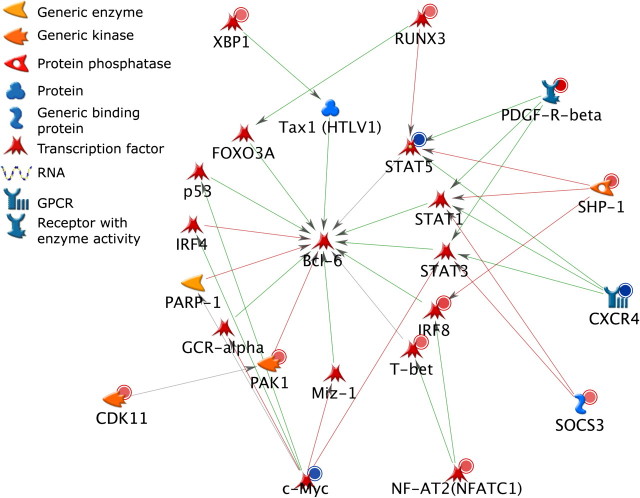
FIG. 6.
Network analysis of the 78 direct AHR target genes and Bcl-6. Molecules with red circles denote direct AHR target genes that were upregulated, whereas molecules with blue circles denote genes that were downregulated. Green arrows denote positive regulation, red arrows denote negative regulation, and gray arrows are not defined as to the direction of regulation.

