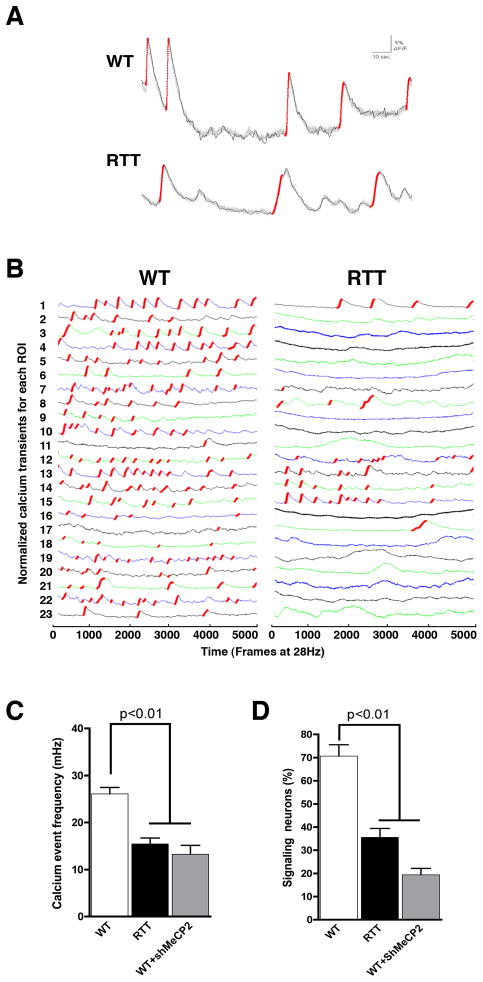
Figure 5.
Altered activity-dependent calcium transients in RTT-derived neurons. (A), Representative examples of WT and RTT calcium signal traces. Red traces correspond to the calcium rise phase detected by the algorithm used (see supplemental methods). (B), Fluorescence intensity changes reflecting intracellular calcium fluctuations in RTT and WT neurons in different Regions of Interest (ROI). (C), RTT neurons show a lower average of calcium spikes when compared to WT control neurons. (D), The percentage of Syn::DsRed-positive neurons signaling in the RTT neuronal network is significantly reduced when compared to controls. Data shown as mean ± s.e.m. See also Figure S5.

