Figure 6.
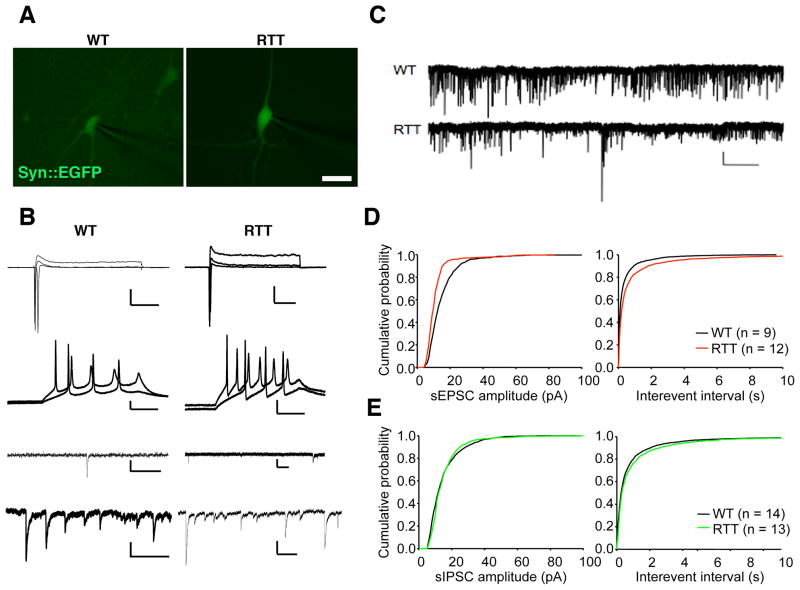
Decreased frequency of spontaneous postsynaptic currents in RTT neurons. (A), Fluorescence micrographs of representative WT and RTT neurons. Bar = 10 μm. (B), Electrophysiological properties of WT and RTT neurons. From top to bottom: Transient Na+ currents and sustained K+ currents in response to voltage step depolarizations (command voltage varied from −20 to +30 mV in 5 mV increments when cells were voltage-clamped at −70 mV, Bars = 400 pA and 50 ms). Action potentials evoked by somatic current injections (cells current-clamped at around −60 mV, injected currents from 10 to 40 pA, Bars = 20 mV and 100 ms), sEPSCs (Bars = right, 20 pA, 100 ms; left: 10 pA, 500 ms), and sIPSCs (Bars = right, 20 pA, 500 ms; left: 20 pA, 400 ms). (C), Sample 4-min recordings of spontaneous currents when the cells were voltage-clamped at −70 mV (Bars = 20 pA and 25 s). (D), Cumulative probability plot of amplitudes (left panel, 1 pA bins; p<0.001) and inter-event intervals (right panel, 20 ms bins; p<0.05) of sEPSCs from groups of WT (black) and RTT (red) cells, respectively. (E), Cumulative probability plot of amplitudes (left panel, 1 pA bins; p<0.05) and inter-event intervals (right panel, 20 ms bins; p<0.05) of sIPSCs from each group (WT, black; RTT, green).

