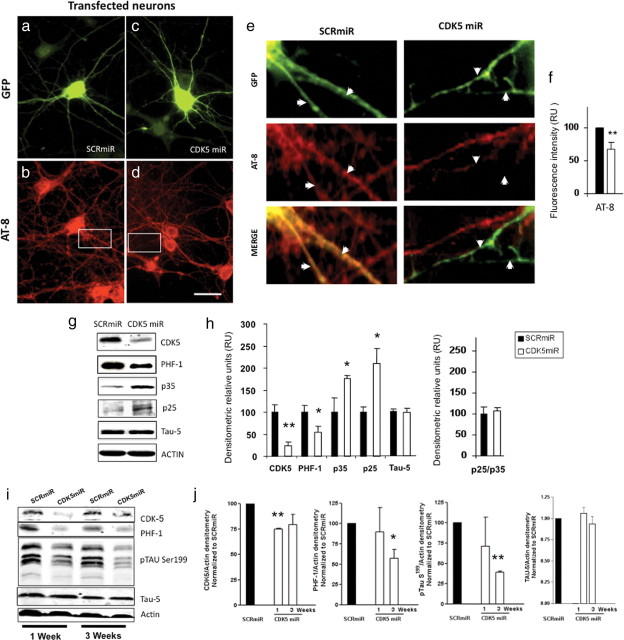
Figure 2.
CDK5miR decreased the levels of phosphorylated tau. a, GFP expression of hippocampal neurons transfected with pCMV-GIN-ZEO.shRNAmirSCR.GFP (SCRmiR). b, Immunofluorescence of phosphorylated tau with AT-8 antibody in neurons transfected with SCRmiR expressed in pCMV-GIN-ZEO-GFP plasmid. c, GFP expression of hippocampal neurons transfected with pCMV-GIN-ZEO.shRNAmirCDK5.GFP (CDK5miR). d, Immunofluorescence of phosphorylated tau with AT-8 antibody in neurons transfected with CDK5miR; a decrease in AT-8 immunoreactivity was detected. Green, GFP fluorescence; red, Alexa 594. Magnification, 60×. Scale bar, 20 μm. n = 4. e, Zoom insets from b and d. The arrows indicate neuritic processes of transfected cells. The phospho-tau (AT-8) immunoreactivity decrease in neurites transfected with CDK5miR (GFP-positive cells). f, Quantification of the fluorescence intensity of AT-8 immunoreactivity in neurons transfected with CDK5miR and SCRmiR, using the software Image Scope-Pro (Media Cybernetics). RU, Relative units. n = 4. *p < 0.05. g, CDK5, PHF-1, p35, and p25 were evaluated by Western blotting in neuronal primary cultures transduced with AAV-CDK5miR and AAV-SCRmiR. β-Actin was used as loading control. Representative blots are shown. h, Densitometric quantification from g; p25/p35 ratio was calculated. Data are presented as mean ± SEM. p25 and p35 densitometry values were previously normalized to β-actin. n = 6. *p < 0.05. i, CDK5, PHF-1 tau, pSer199 tau, and tau-5 Western blotting from hippocampal lysates of C57BL/6 mice injected with LV-CDK5miR and LV-SCRmiR. Representative blots are shown. j, Densitometry of Western blots in LV-CDK5miR- and LV-SCRmiR-treated mice was measured and normalized to actin. Data are plotted as the percentage of change between control (SCRmiR) and treated (CDK5miR) groups and presented as mean ± SEM. n = 4. *p < 0.05; **p < 0.001.

