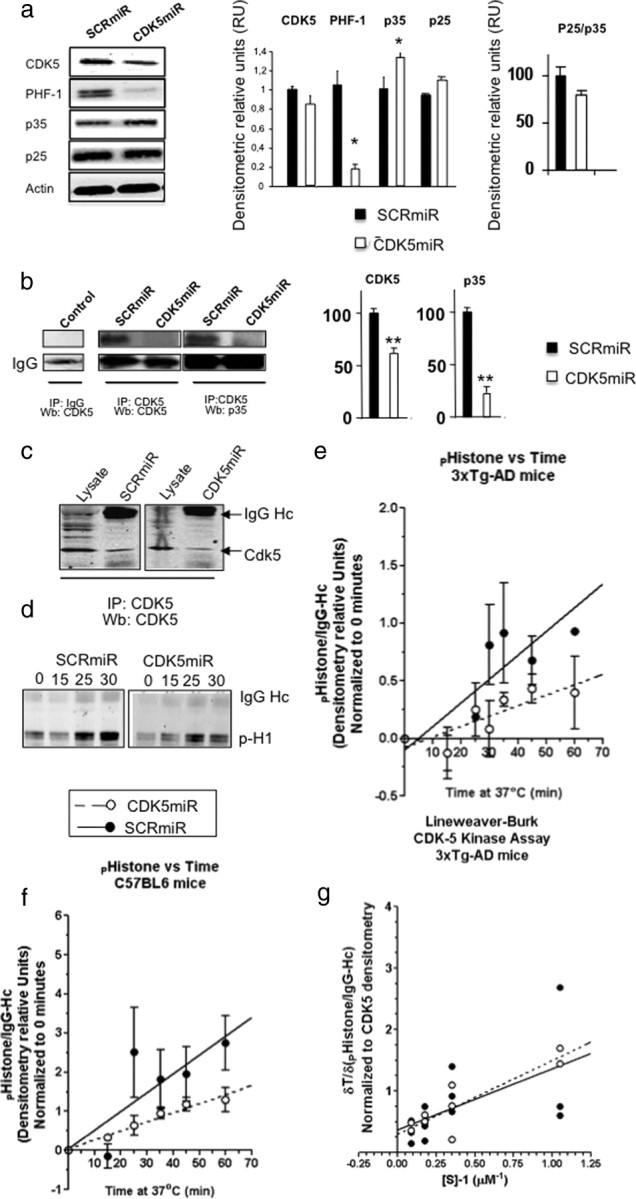
Figure 4.

CDK5miR reduces CDK5 levels in the hippocampus of triple-transgenic Alzheimer mice without affecting its kinetic activity. a, CDK5, PHF-1, p35, and p25 Western blotting from hippocampus of 3×Tg-AD mice treated with SCRmiR and CDK5miR. β-Actin was loading control. Representative blots are shown. Densitometric quantification was done. RU, Relative units. n = 3. *p < 0.05. b, CDK5 IP, Western blot (Wb): CDK5, p35 of neuronal primary cultures. A band corresponding to the IgG heavy chain was detected and used as loading control. Negative for IgG immunoprecipitation was used as an internal control. Representative blots are shown. Densitometric quantification of CDK5 and p35 proteins was done. RU, Relative units. n = 3. **p < 0.01. c, CDK5 IP, Wb: CDK5 from hippocampus of 3×Tg-AD mice treated with SCRmiR and CDK5miR. d, Temporal course for CDK5 kinase activity was detected by phosphorylated histone antibody. A band corresponding to the IgG heavy chain was detected. e, f, Product formation using CDK5 IP from hippocampi of transgenic (e) and wild-type (f) mice was measured by densitometry and plotted against the reaction time. Linear regression was used and the fitting line was drawn (GraphPad Software). SCRmiR is shown as closed circles and a straight line, and CDK5miR is shown as open circles and a dotted line. Data are presented as mean ± SEM. n = 3. *p < 0.05. g, Phosphohistone formation was calculated as indicated above in several assays where substrate concentration was varied and normalized to CDK5 densitometry in the immunoprecipitation. Reaction rates were measured as the slope of the curve, and Lineweaver–Burk plot is graphed. Each value is presented in the dot plot and lineal regression was used to fit the model. CDK5miR is shown as closed circles and a straight line, and SCRmiR is shown as open circles and a dotted line.
