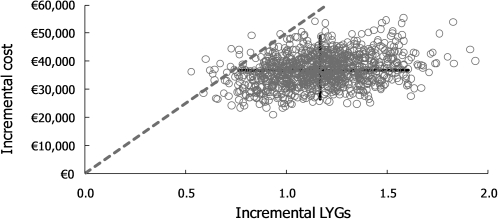
Figure 2.
The cost-effectiveness plane (CEP) represents the results of 1000 simulations for incremental lifetime costs (the pharmacy retail price for trabectedin was assumed) and life years gained (LYG) for TRA → end-stage treatment (EST) versus EST (EST is fixed in the origin of the CEP). 95% confidence intervals for incremental costs and effects, and a dashed line showing where the threshold for €50 000 per LYG stands are shown in the CEP; all points under this line were associated with an incremental cost-effectiveness ratio of <€50 000 per LYG. This characterised 98.5% of the simulations.

