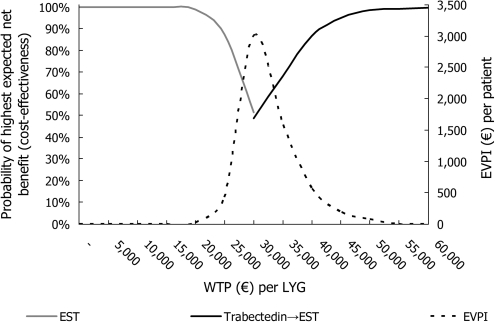
Figure 3.
Cost-effectiveness acceptability frontier (solid curves), which presents the optimal treatment options, together with expected value of perfect information (EVPI, dashed curve) frontier. The pharmacy retail prices were assumed for trabectedin. EST, end-stage treatment; LYG, life years gained.

