
Figure 2.
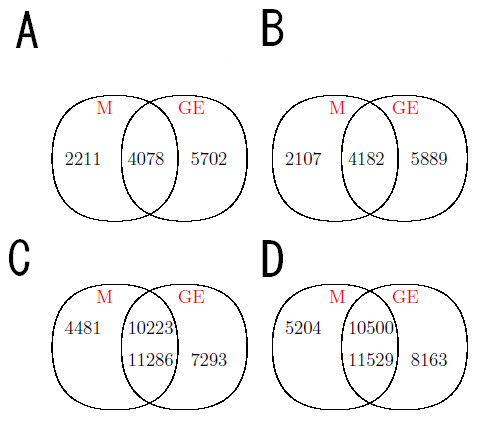
Number of probes and genes. Summary of the number of genes and probes included in our statistical analysis after the preprocessing; Panel A and C: numbers of genes (A) and probes (C) for OHT v.s. WT; Panel B and D: number of genes (B) and probes (D) for ICI v.s. WT. Numbers in the intersection area represent the genes or probes included in the statistical analysis. GE: gene expression data; M: DNA methylation data.