
Figure 2.
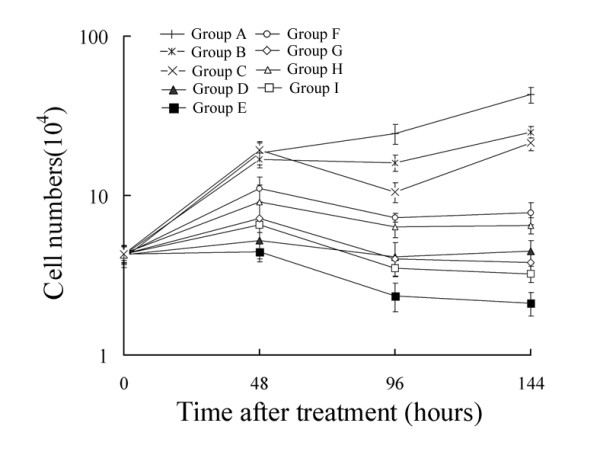
Growth curves of U87 cells in different groups. Group A; control nonirradiated cells; Group B: cells treated with 4 Gy of [60Co] γ-rays; Group C: cells treated with 8 Gy of [60Co] γ-rays; Group D: cells treated with 4 Gy BPA-BNCT; Group E: cells treated with 8 Gy BPA-BNCT; Group F: cells irradiated in the reactor for the same treatment period as used for Group D; Group G: cells irradiated in the reactor for the same treatment period as used for Group E; Group H: cells irradiated with 4 Gy in the reactor; Group I: cells irradiated with 8 Gy in the reactor. Data represent the mean ± SD of triplicate experiments.