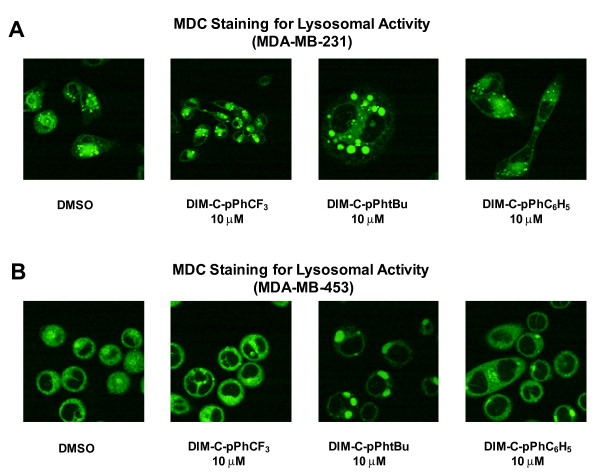
Figure 3.
Detection of lysosomal activity with monodansylcadaverine (MDC) staining. MDA-MB-231 [A] and MDA-MB-453 cells [B] were treated with DMSO or 10 μM DIM-C-pPhCF3, DIM-C-pPhtBu or DIM-C-pPhC6H5 for 24 h. MDC was loaded into cells and incubated at 37°C for 10 min and visualized using confocal microscopy as described in the Materials and Methods. At least 5 areas were scanned for each well and images represented are characteristic of treatment replicates. Width of each field is 100 μm except for right two panels in [A] which are 50 μm.

