Figure 2.
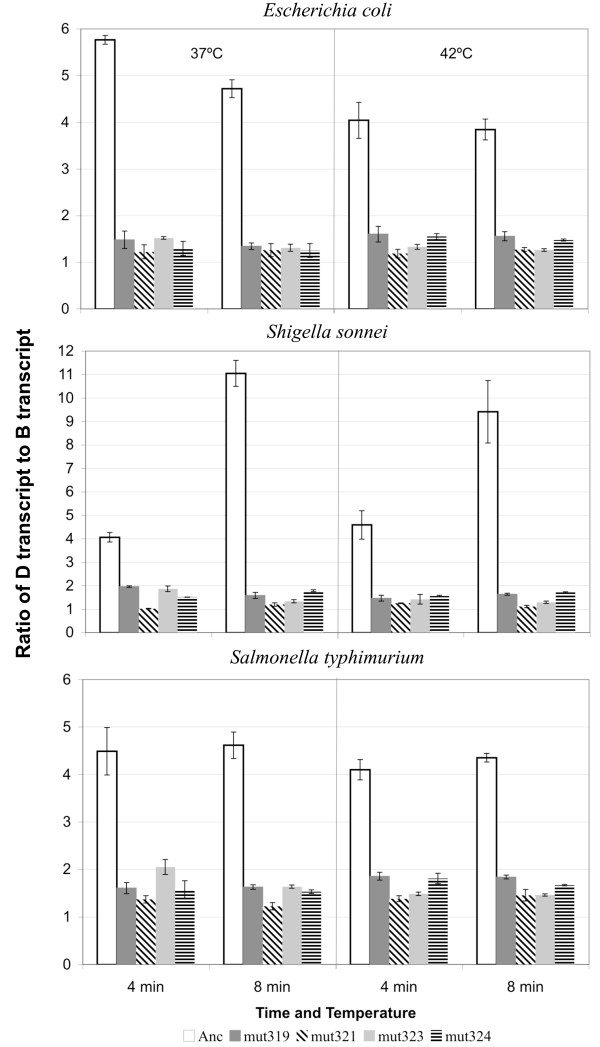
Transcript levels differ between ancestor and promoter mutant strains at two temperatures in three bacterial hosts. The amount of transcript starting from the D promoter was measured relative to the amount of transcript starting from the B promoter for each phage strain using quantitative PCR. Injection of DNA into host was synchronized by attachment at 15°C and then addition to LB at 37°C. Samples were taken at 4 and 8 min after injection, which is prior to the start of cell lysis. The y-axis indicates the ratio of the D transcript to the B transcript. Bars are the mean and error bars the standard error of two (S. sonnei) or three replicate assays. Solid bars are mutant strains with non-synonymous substitutions in C, hatched bars are synonymous in C. Relative transcript level of the ancestor is significantly greater than the four mutants for all host/temperature/time combinations (Table 2). Note the difference in scale for the S. sonnei graph.

