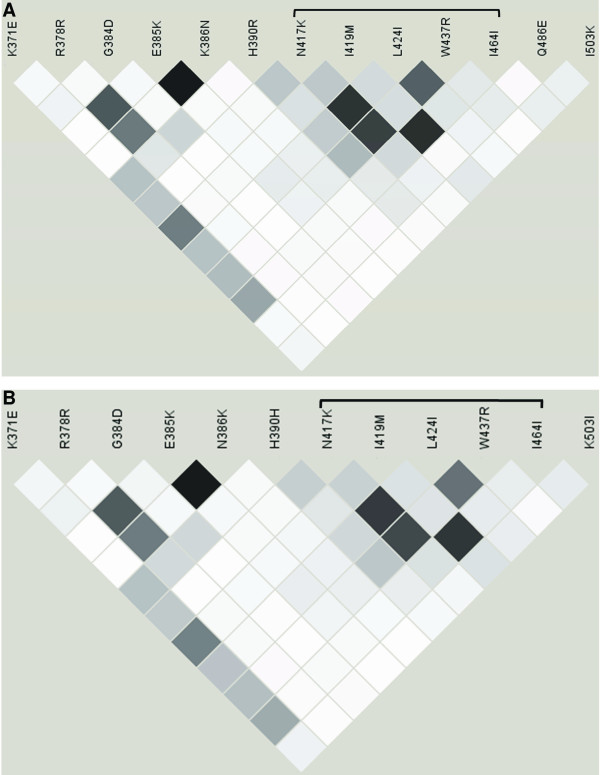
Figure 3.
Linkage disequilibrium in PvDBPII.. Patterns of pairwise linkage disequilibrium (r2) in the PvDBPII-encoding gene from Brazilian isolates. (A) Linkage disequilibrium was calculated for SNPs for which the frequency of the minor allele was at least 0.1 in the entire sample. White: r2 = 0; black: r2 = 1; shades of gray: 0 <r2 < 1. The bracket indicates the cluster of amino acids with the highest r2. (B) LD was calculated as previously described but not including the Amapá population.

