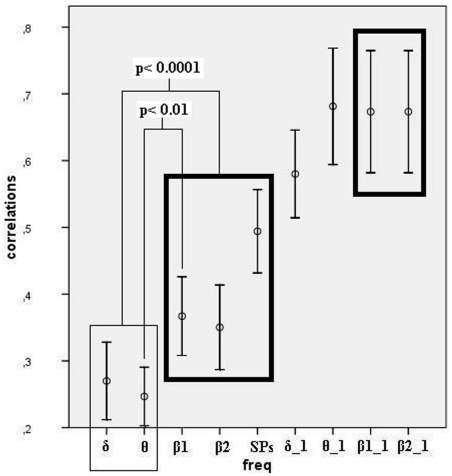
Figure 6. Audio-visual correlations.
The similarity in current density distributions between visual and auditory tasks was measured by the correlations between the identically ordered sets of dipole strengths, in each frequency band and ICA component (Inter-subject averages are shown only for illustration; Comparisons were performed between Fisher's Z transformed correlations; first components: “band”_1; secondary components: w/o extension; bars: 95% confidence interval of the mean). Thick rectangles depict attention-related bands, and thin rectangle, stimulus-related bands. However, first beta components were not used in comparison due to their trivial high correlations, common to most bands (see text).

