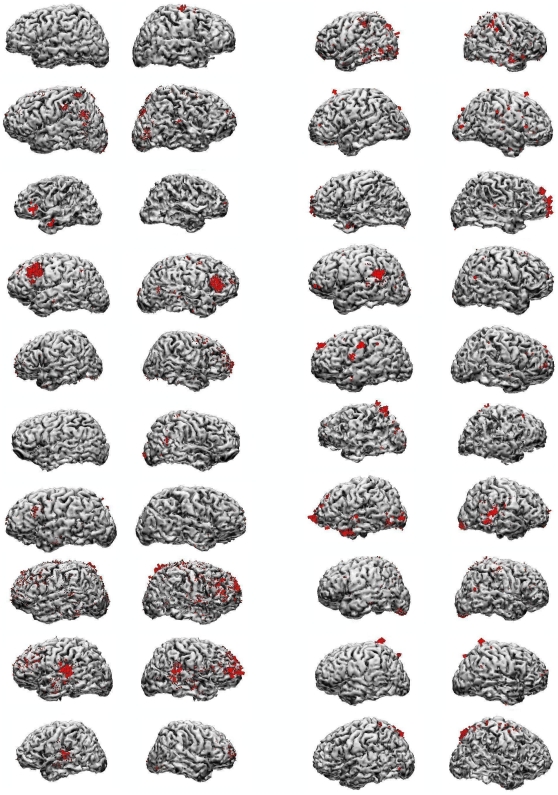
Figure 8. Auditory-visual attention differences.
Significant part of difference in dipole strength distributions between auditory and visual tasks, in all subjects. Illustrated are the differential currents of absolute z-score value beyond a global z = 2.57, adjusted to number of dipole supporting points in each individual (range: z = 3.48 to z = 3.62). Relative local current density (to individual maximum) is represented by red arrows and proportional to arrow size (due to wide differences between maximum and minimum individual values, actual arrows can be noticed entering –or arrow heads exiting- the brain only in a few cases of high local current density, e.g., first and second subjects on top of right column).

