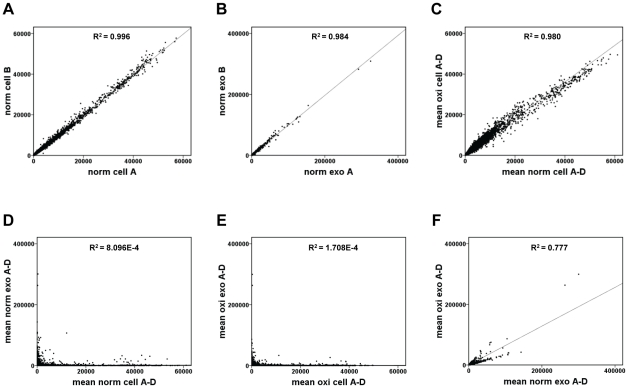
Figure 4. Scatter plots of relationships between mRNA signals in MC/9 cells and exosomes.
a) Reproducibility comparison of mRNA signals between two different cell cultures of MC/9 cells (sample norm cell A and norm cell B) under normal conditions (norm). b) Reproducibility of comparison of mRNA signals between exosomes derived from two different cell cultures of MC/9 cells (sample norm exo A and norm exo B) under normal conditions (norm). c) Relationship between mean mRNA signals between MC/9 cells (samples norm cell A–D and oxi cell A–D) that have been exposed to vehicle (norm) or 125 µM H2O2 (oxi) for 24 h. d) Relationship between mean mRNA signals in MC/9 cells and their released exosomes (samples norm cell A–D and norm exo A–D) under normal conditions (norm). e) Relationship between mean mRNA signals in MC/9 cells and their released exosomes (samples oxi cell A–D and oxi exo A–D) after H2O2 exposure for 24 h (125 µM) (oxi). f) Relationship between mean mRNA signals in exosomes released from MC/9 cells (samples norm exo A–D and oxi exo A–D) after exposure to vehicle (norm) or H2O2 (125 µM) (oxi) for 24 h.

