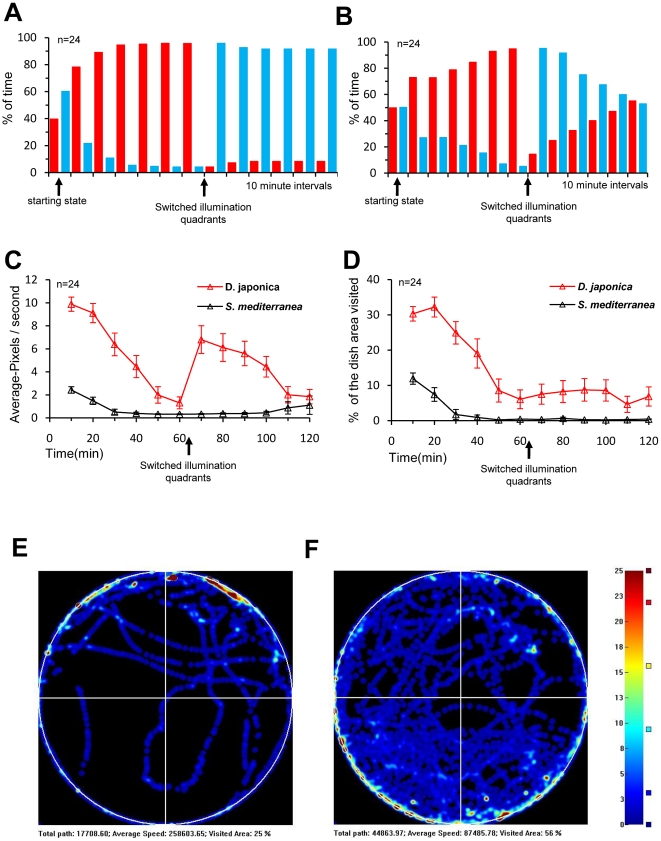
Figure 5. Comparison of planarian exploration behavior and light preference between D. japonica and S. mediterranea.
During the trial one half of the training environment was illuminated with blue light and the other half with red. After one hour, illumination quadrants were exchanged so that the red half was now blue and vice versa (see arrow A–D). (A,B) Preference to light, the histograms summarize the percentage of time spent by the overall worms from each species (S. mediterranea in A and D. japonica in B) stayed in the red or blue illuminated half. Each category bar represents an average of 10 minutes, except for the first category (see arrow) that indicates the initial position of the worms just before the start of the trial, when all dish quadrants were illuminated by red light. Both species preferred the red light and were located in this half by the end of the exploratory phase (n = 23/24 D. japonica, n = 23/24 and S. mediterranea respectively); afterwards, they quit moving and settled down. Reversing the color light in each half induced just some of the subjects (13/24 of D. japonica but only 2/24 of S. mediterranea) to move into the red illuminated half. (C) Comparing movement rates and (D) explored area, both species demonstrated an exploratory phase, after which movement rates and exploration dropped to low levels. D. japonica (red triangles) showed significantly greater average speed and area explored than did S. mediterranea (black triangles). (E for S. mediterranea , F for D. japonica) Occupancy maps enable the ready evaluation of overall positional trends during trials. The plots generated from the behavioral data of the most active worm from each species during the first hour of the trial are shown. The red illuminated half is up in E and down in F, both indicating a preference for red over blue light as well as for the edge of the dish.

