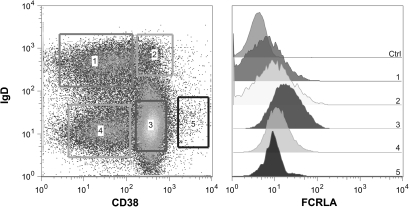
Fig. 1.
Analysis of intracellular FCRLA expression by flow cytometry. Single-cell suspensions from tonsils were prepared and stained for cell surface CD19, IgD, and CD38. The cells were then fixed with 1% PFA, washed and permeabilized with 0.1% saponin prior to intracellular staining with Alexa 488-conjugated M101 FCRLA mAb. The staining gates for the CD19+ tonsil B-cell sub-populations are depicted on the left side and FCRLA expression by cells in each subpopulation is shown on the right. 1. naive B cells, 2. Pre-GC cells, 3. GC cells, 4. Memory cells and 5. Plasma cells. The profiles shown are representative of five separate tonsil preparations.

