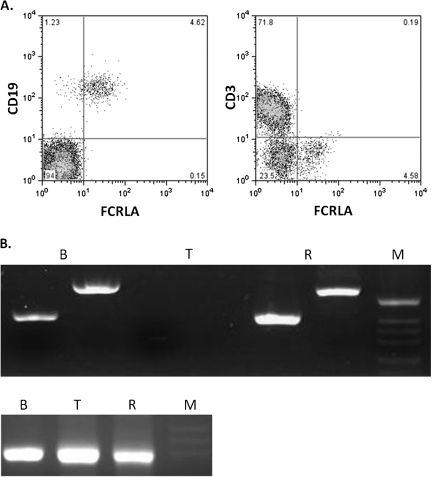
Fig. 2.
Resting peripheral blood B cells express FCRLA. (A) PBMC were stained for cell surface CD19 (left panel) or CD3 (right panel) and then fixed, permeabilized and stained for intracellular FCRLA. Most B cells express FCRLA but T cells are negative. (B) (Top panel) RT–PCR was performed on FACS sorted PBMC B and T cells and the Ramos B cell line. Two primer pairs, one located in exons 2 and 3 (first lane in each group) and the other in exons 4 and 5 (second lane), amplified FCRLA from B cells (B) and Ramos cells (R) but not from the T cells (T). The bottom panel illustrates amplification of β-actin from the same samples. M, size markers.

