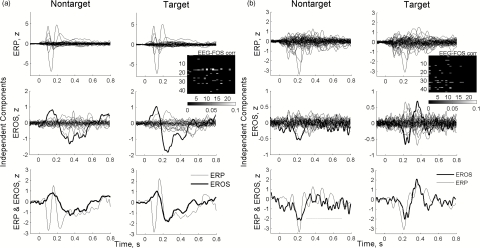
Figure 3.
Representative examples of event-related responses (produced by trial averaging of independent components of EEG and FOS) from subjects 28 (a) and 1 (b). Best optical responses are shown in bold. Note a good correspondence between the temporal profiles of the best correlated ERP and EROS components (bottom panels) as well as similar responses for targets and nontargets. Inserts show matrices of correlation coefficients between all remaining EEG (the ordinate) and FOS (the abscissa) independent components. Matrices show only correlation coefficients with absolute values significantly different from zero (p < 0.001 after Bonferroni correction).

