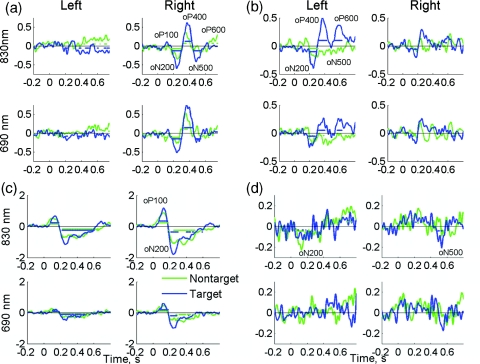
Figure 5.
EROS waveforms recorded from subjects 1 (a), 8 (b), 28 (c) and 25 (d). Each panel shows signals at two wavelengths from the best channel and its counterpart in the opposite hemisphere. Note the almost identical waveforms and similar responses for targets (blue) and nontargets (green). Horizontal lines in each graph indicate the time bins where EROS was significantly diffrent from zero [(a) to (c): p < 0.01 for subjects 1, 8, and 28, and (d): p < 0.05 for subject 25 with the lowest SNR]. (Color online only.)

