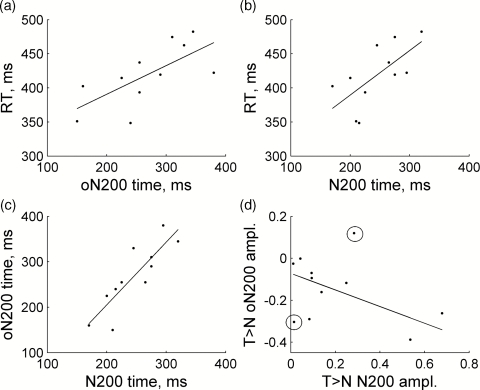
Figure 8.
Group-level regression analysis on correlations between the timing of target-related oN200∕N200 waves and the reaction time [(a) and (b)] and between the timing∕amplitudes of oN200 and N200 waves with respect to each other ](c) and (d)]. Circled points in (d) are outliers that were discarded during statistical analysis of this particular regression.

