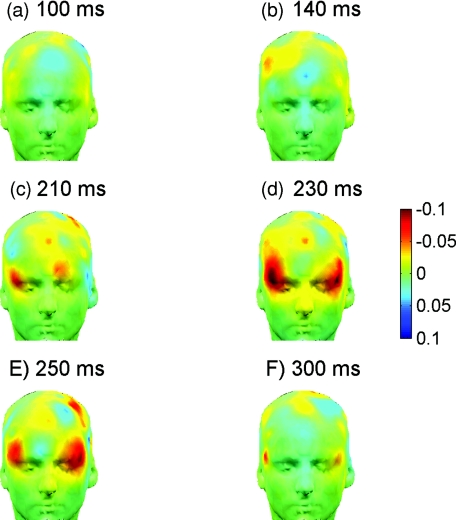
Figure 9.
Temporal evolution of frontal activation during target detection in the Go-NoGo task through optical imaging with the fast signal. Scalp maps of grand average differential EROS (targets versus nontargets) are produced by interpolation and projection of signal amplitude onto a human scalp template. Note initial activation in the right prefrontal cortex at 140 to 210 ms followed by coactivation of the homologous area in the left hemisphere at 230 to 250 ms.

