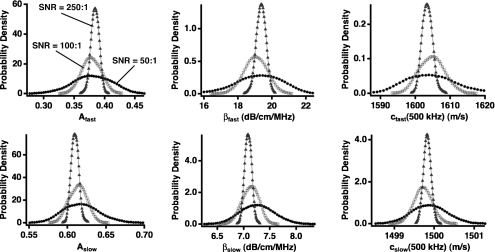
Figure 3.
Marginal posterior probability density functions for the three sets of simulated data at varying signal-to-noise ratio (SNR) levels. All distributions integrate to 1. SNRs of 50:1, 100:1, and 250:1 are shown in circles, squares, and triangles, respectively. As the signal quality improves, the width of the distributions decreases, indicating increased confidence in the parameter value. However, the mean and peak parameter values do not change appreciably.

