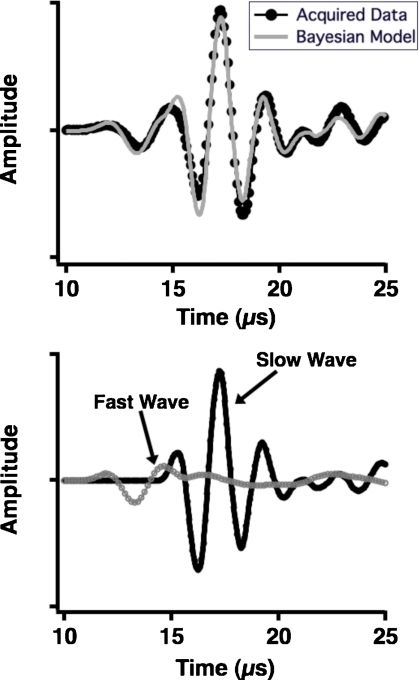
Figure 7.
Data acquired at 500 kHz at one site on a human femur condyle specimen (top panel, dark circles) with the model constructed from the parameters that maximized the joint posterior probability superimposed (top panel, gray line). The fast and slow waves that comprise the model are displayed in the bottom panel.

