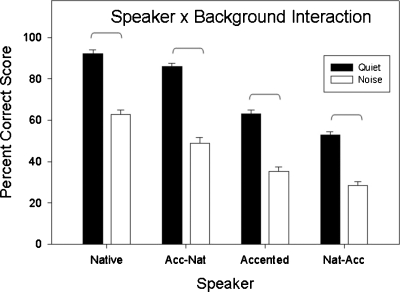
Figure 3.
Percent correct recognition scores for target words in quiet and noise in four speaker accent conditions, collapsed across the three listener groups. Error bars reflect one standard error of the mean. Brackets connect bars of listening environments in which all listeners exhibited statically significant performance differences.

