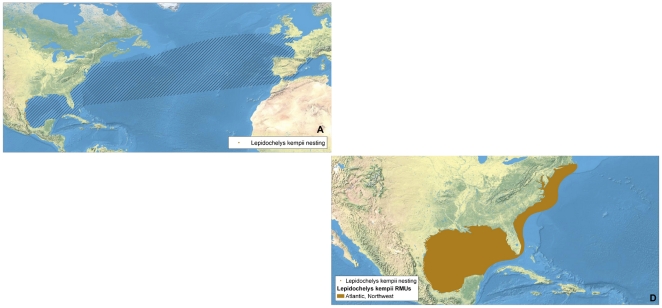
Figure 6. Multi-scale Regional Management Units for Kemp's ridley turtles Lepidochelys kempii.
Individual maps are presented for A) global nesting sites and in-water distributions (global distributions for each species represented by hatching); and D) Regional Management Units (shown with nesting sites). Nesting sites that were unquantified or have no count values reported since 2000 are represented by black squares, whereas nesting sites for which count data are available are represented by a colored circle. Putative RMUs (see text for description) are noted by asterisks in the figure legends, and are colorless. Note: There are no genetics maps (Panels B or C) for L. kempii because all individuals are presumed to belong to same stock and RMU. Data shown are contained in metadata tables (Appendix S2).

