
Figure 2.
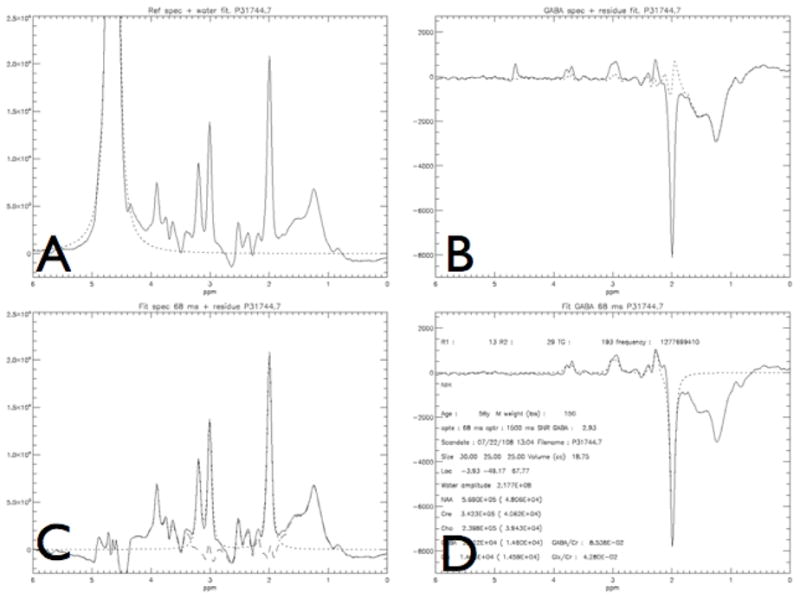
Model fitting of the spectra obtained from a patient with focal hand dystonia: Panels A–D depict different steps in the model fit as described in Methods section. Close approximation of the model and the data can be seen here clearly, as indicated by the small residual. Panel A depicts the output of the unedited spectrum with the large water peak, and the model fit to water, in order to remove the water peak. Once this is done panel C shows the standard MR spectrum without the editing pulse applied with the fit (dotted line) to Cho, Cre, and NAA and the residual (dot -stripe line). Panels B and D show the spectrum obtained with the editing pulse, after the subtraction from C, yielding the GABA and Glx peaks and the model fit with the residual (data -fit from panel D). Panel D is the final output with additional information, with the model the fit to GABA, Glx and NAA that were measured in arbitrary units which were later referenced to Cre for our statistical analysis.