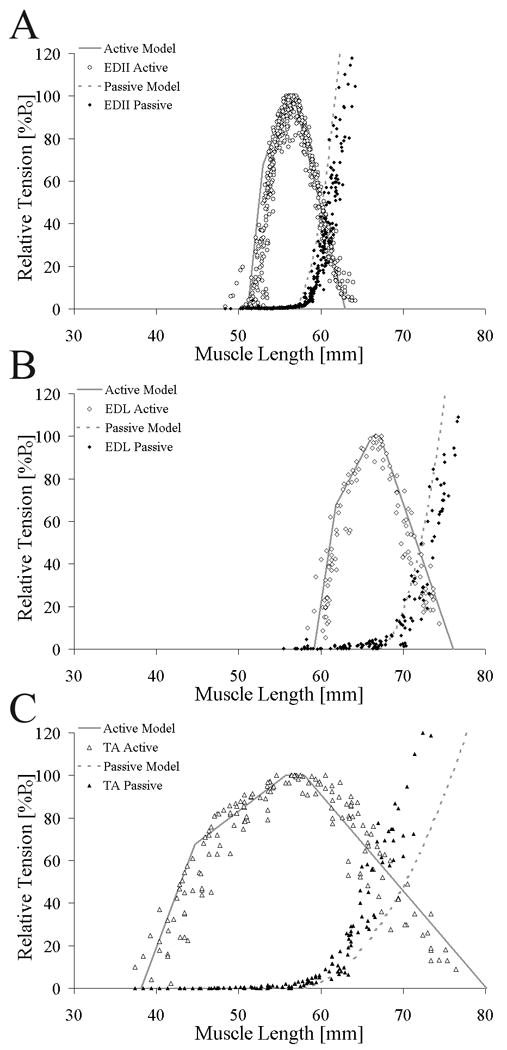
Figure 2.

Relationship between active theoretical (solid gray line) and experimental (open symbols) whole muscle length-tension relationship and passive theoretical (dotted gray line) and experimental (filled symbols) whole muscle length-tension relationship for (A) EDII (○), (B) EDL (◊), and (C) TA (△). Theoretical and experimental data were highly correlated for all muscles (TA: r2=0.81, ICC=0.84; EDL: r2=0.90, ICC=0.86; EDII: r2=0.87, ICC=0.89). Relative tension (muscle tension normalized to maximum tension) was plotted on the ordinate to facilitate comparison between muscles.
