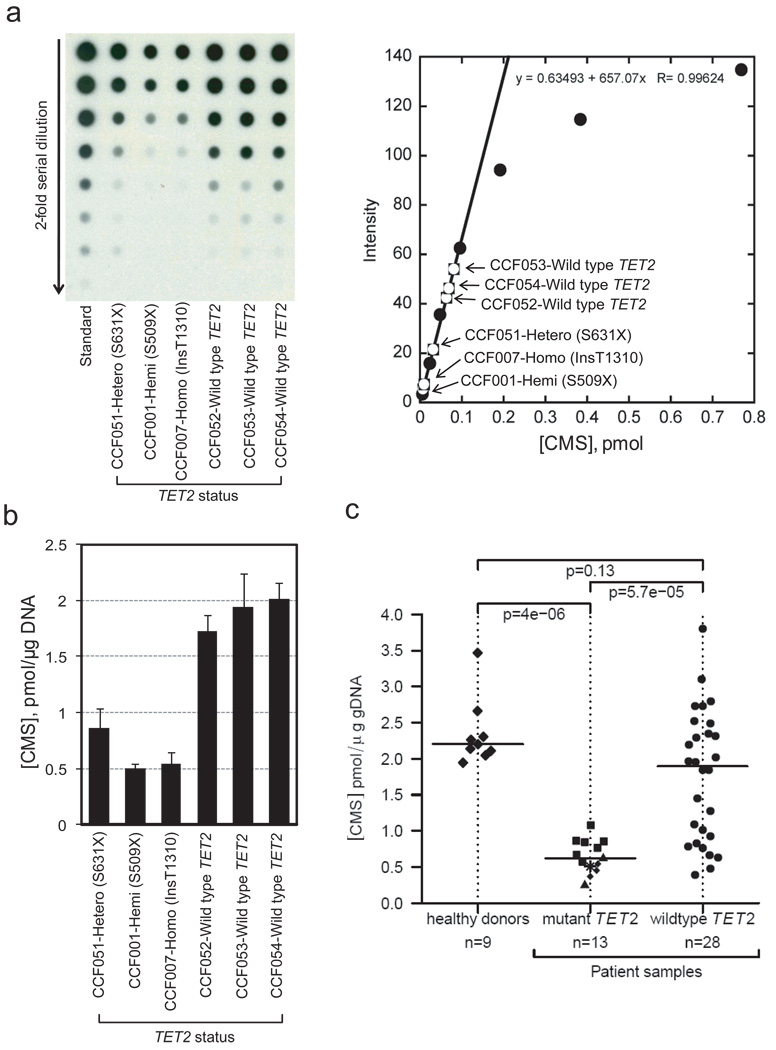
Figure 2. TET2 mutational status correlates with 5-hmC levels in patients with myeloid malignancies.
a, Quantification of 5-hmC by anti-CMS dot blot. Left, A representative dot blot of genomic DNA isolated from bone marrow aspirates of patients with MDS/MPN and TET2 mutational status as indicated. A synthetic oligonucleotide with a known amount of CMS was used as standard. Right, The linear portion of the standard curve was used to estimate the amount of 5-hmC in DNA from patient samples.
b, Bar graph of data from Fig. 2a. The three patients with TET2 mutations show lower 5-hmC levels than the three patients with wild type TET2. Error bars indicate standard deviation (n=3).
c, Correlation of 5-hmC levels with TET2 mutational status. CMS levels in bone marrow samples from healthy donors and patients with myeloid malignancies (Suppl. Table S1) are shown as the median of triplicate measurements (Suppl. Fig. 7b). In the TET2 mutant group, squares, triangles, diamonds and the star indicate homozygous, hemizygous, heterozygous and biallelic heterozygous mutations, respectively (for detail definition, see online methods). The horizontal bar indicates the median for each group. p-values for group comparisons were calculated by a two-sided Wilcoxon rank sum test. Patients bearing TET2 mutations show uniformly low 5-hmC expression levels.

