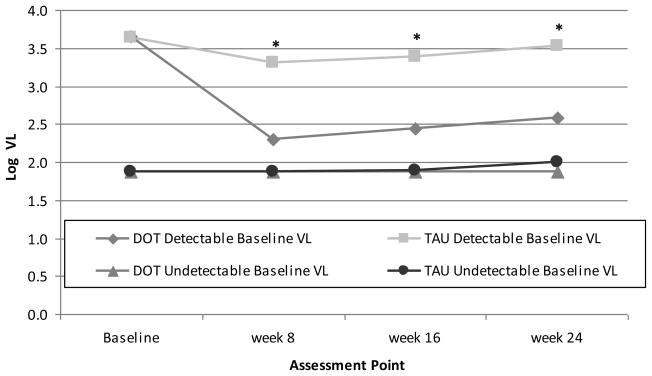
Figure 3b.
Differences in log10 viral load by study arm at each assessment point during the 24-week intervention period, stratified by baseline viral load (≥75 copies/ml versus <75 copes/ml). Precise estimates available in online supplementary materials.
DOT: directly observed therapy; TAU: treatment as usual; VL: viral load
*p<0.02 for difference between DOT and TAU among participants with detectable baseline VL, based on mixed effects model analysis.

