
Figure 2.
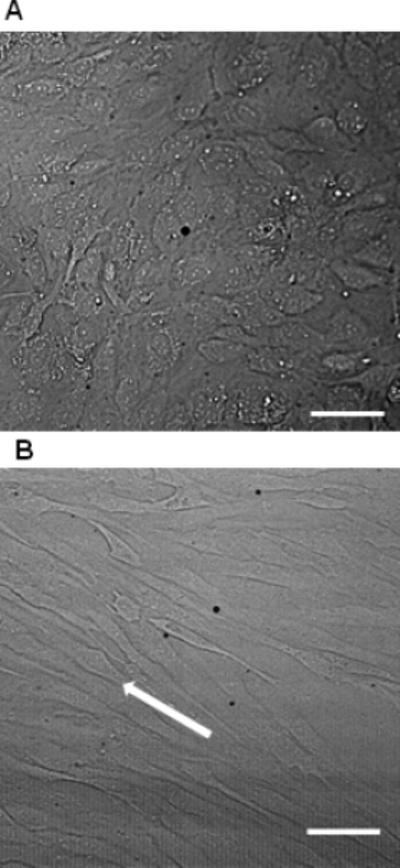
Representative HUVEC cell morphology of static cultivation (A) and shear stress cultivation (B). The cells cultivated under 5 dyne/cm2 for 5 day exhibited orientation and elongation along the direction of the flow (arrow in B). The scale bars represent 100 μm.