
Figure 4.
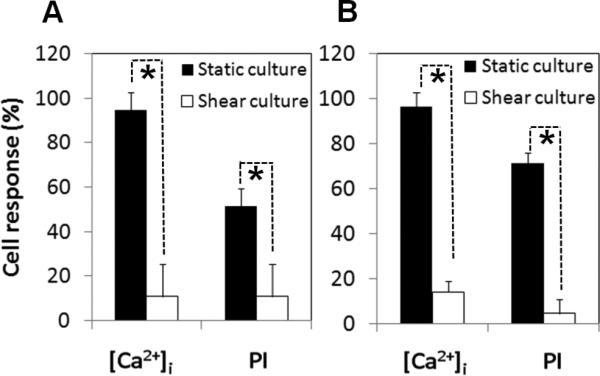
Shear stress cultured cells exhibited different response to US application from the statically cultured cells. (A) Shear stress cultured bEnd.3 cells (n = 33) exhibited lower percentage of responses in PI uptake and [Ca2+]i changes compared with the static group (n = 32). (B) Shear stress cultured HUVECs (n = 44) had lower percentages of responses compared with the static group (n = 30). The asterisk indicates P < 0.05 for a Student's t-test between cells in the static and shear stress group.