Fig. 6.
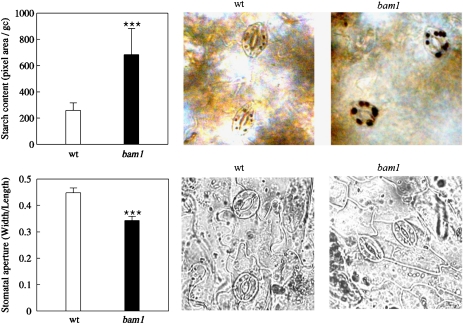
Starch content in guard cells and stomatal aperture analysis on wild-type and bam1 mutant plants. Leaves were collected from plants hydroponically grown for 26 d, after 6 h of light exposure. Both measurements were performed throughout digital image processing. After iodine staining, starch content (upper graph) was quantified as the total pixel area of the starch accumulations visible in chloroplasts of single guard cells. Values are means ±SE (n=72 guard cells). In the pictures on the right the typical starch accumulation observed in wild-type and bam1 guard cells. In the lower graph, stomatal aperture measurement was determined as the ratio between width and length of the stomatal pore. Values are means ±SE (n=70 stomata). Statistical analysis by ANOVA and a Duncan's Test (P <0.01) were conducted. Statistically significant differences are indicated by three stars in the graphs. (This figure is available in colour at JXB online.)

